Tornadoes
The question of what was the worst tornado in Louisiana would have to
be answered somewhat subjectively depending on what measure is considered.
Based on the 1950-1995 period, the tornado with the highest wind speed,
as judged from the reported Fujita Scale rating, occurred in Madison Parish
on 21 February 1971. However, the tornado that caused the greatest
number of deaths was reported in Lafourche Parish on 3 October 1964.
While 75% of all tornadoes in Louisiana have a path of length less than
approximately 4 miles, a tornado hit Caldewell Parish on 22 March 1953
and traveled more than 69 miles over the ground. Similarly, 75% of
all Louisiana tornadoes are less than 300 ft wide, but one reported in
Concordia Parish on 30 April 1994 reached 1 mile in width.
As the inset in the figure below shows, slightly more tornadoes occur
in the southern parishes of Louisiana than in the northern ones.
Once again, the distribution of tornado reports differs somewhat in the
two regions. Both areas exhibit a clear maximum in the spring, with
the northern parishes having their peak in April while the southern parishes
show a peak in May. Secondary maxima occur in winter, with both areas
having a peak in November. It is worth noting that a distinct minimum
in tornado reports occurred in northern Louisiana from July through October
while southern Louisiana maintains a more uniform probability of tornado
occurrences throughout the year.

Total number of tornado reports in Louisiana by month for the northern
(latitude > 31¡ N) and southern (latitude <= 31¡ N) parts of the state.
Data source: Storm Prediction Center of the National Weather Service
As with most other severe weather events, tornadoes in Louisiana tend
to occur most often in the afternoon hours with the greatest probability
in both northern and southern Louisiana occurring between 3 and 4 PM.
Northern parishes show again show a distinct minimum between 5 and10 AM
while a flatter distribution is observed in southern Louisiana.

Total number of tornado reports by hour of the day for the northern
(latitude > 31¡ N) and southern
(latitude <= 31¡ N) parts of the state.
Data source: Storm Prediction Center of the National Weather Service
The average number of tornadoes per year, normalized to a 1000 sq. mile
area, has been computed for each parish. The spatial distribution
of this variable or of tornadoes displayed by their F-scale rating can
be viewed using ESRI's Internet Map Server (IMS) running at ULM.
For a brief description of how to use the tools in IMS, click here.
Perhaps somewhat surprisingly, as indicated above, southern Louisiana had
more tornadic activity during the period of study than northern Louisiana.
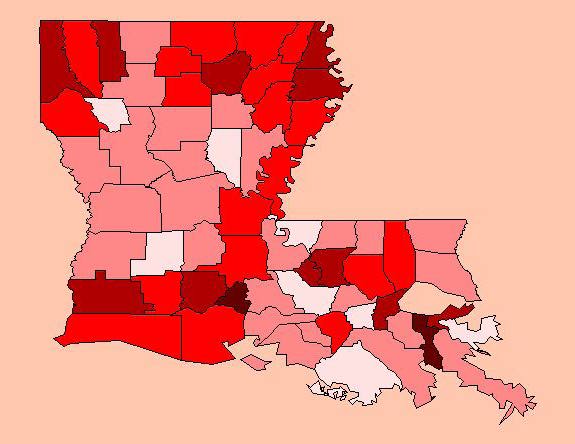
To view the map of the average number of tornadoes per year per 1000
sq. miles, click here or on the
image below.
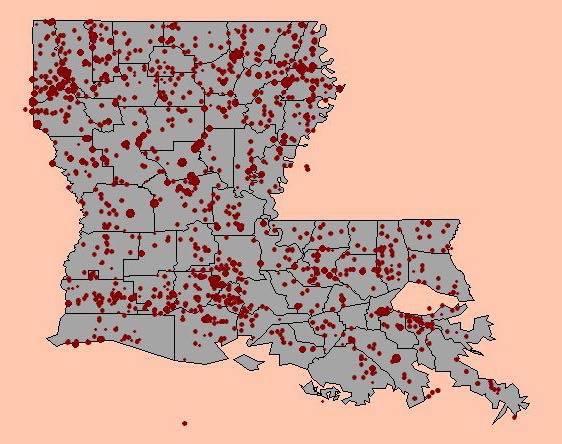
Jefferson Parish experienced the greatest frequency of tornadoes between 1950
and 1996, averaging nearly 2 tornadoes per year per 1000 sq. miles. St.
James Parish did not report any tornadoes during this period. The spatial
distribution of tornadoes over the state (darker colors correspond to higher
frequencies) suggests that there may be some bias in
the data around population centers. For example, it can be argued that
there are more reports of tornadoes along the I-10 and -20 corridors than in
other areas. Another maximum appears to exist in the parishes along the
Mississippi River.
To view the map of each tornado displayed by its F-scale rating, click
here or on the image below.